
Last Updated on 2020-09-02 by toshiikuo
結論:米国のみよりも全世界
理由
- ここ10年は米国株の一人勝ちだが、過去には米国が負けている期間もあり、この先は誰にもわからない。
- 世界経済は1960年代からほぼ毎年成長しており、今後もそれは続くと推測できる。
- 米国のみよりも全世界に分散したほうが価格変動は抑えられる。
- 今後米国以外の国が台頭したときに、全世界株式であれば後悔せずに投資を続けられる。
根拠となるデータ
世界経済はほぼ毎年成長している。
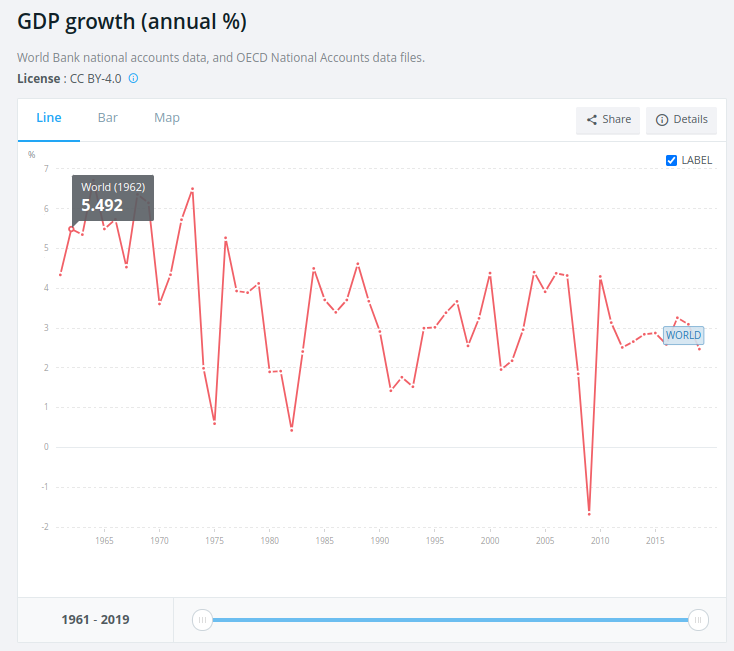
GDPの成長は企業の収益増加を意味するので、株価も上がる。
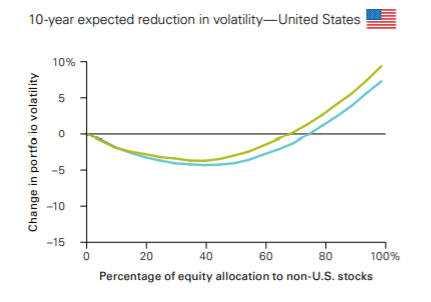
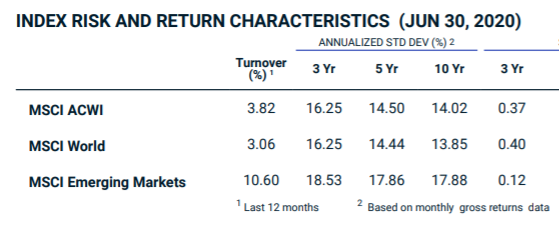
アメリカのみに投資するよりも、他の先進国を組み入れたほうが変動率は低い
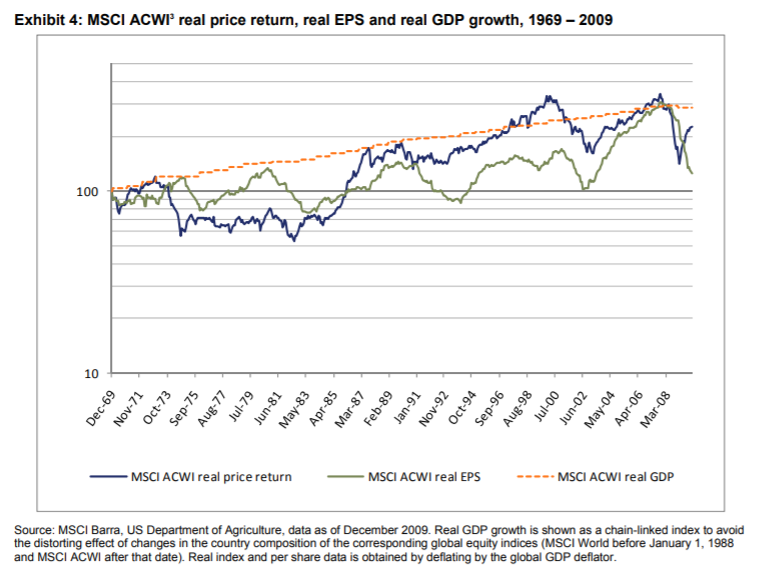
https://www.msci.com/documents/10199/8d97d244-4685-4200-a24c-3e2942e3adeb
米国株とその他先進国のパフォーマンス比較。米国が買っているときが多い?

https://www.msci.com/documents/10199/8d97d244-4685-4200-a24c-3e2942e3adeb
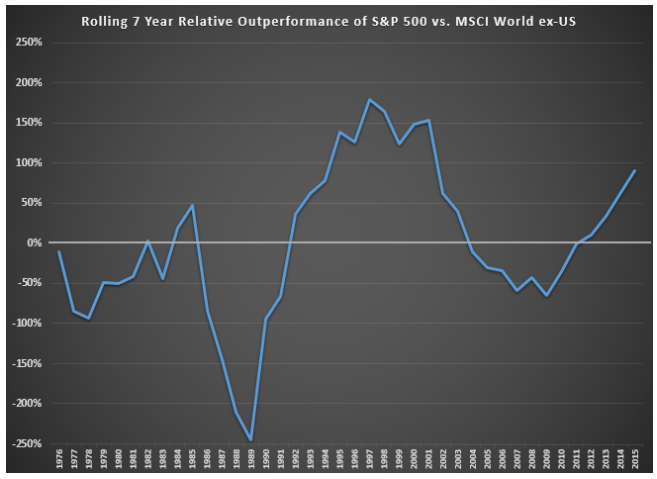
S&P500とMSCI World Index(除く米国)のパフォーマンスの比較。期間によってパフォーマンスが違い、どちらが良いとは言えない。
ちなみに1990年にかけての米国の負けは、日本のバブルによる部分が大きい。
https://awealthofcommonsense.com/2016/02/when-diversification-works/#:~:text=The%20S%26P%20500%20has%20outperformed,the%20world’s%20markets%20over%20historically.&text=At%20the%20seven%20year%20interval,outperformed%2048%25%20of%20the%20time.
新興国も組み入れると更に変動率は下がる。
各インデックスの構成国は以下。ACWIはAll Country World Indexの略。

ピンバック: 妻子持ち3人家族の年収500万サラリーマンの投資戦略 - AKIBLOG
ピンバック: 妻子持ち3人家族の年収500万サラリーマンの投資戦略 - Akinai Life